CURE - Detector Redmine Issues
CURE - The homebrewed monitoring solution. Read more about it in my previous posts:
- CURE-Design
- CURE-Environment
- CURE-Database design
- CURE-Detector foundation
- CURE-Detector-step-by-step
- CURE-GUI
Background
The Swedish branch has been using Redmine for a long time. Redmine is an open source project management tool, and it has served us well for close to a decade now. Recently we decided to demote it completely for our customer projects in favor of Atlassian JIRA/Confluence, since most of the projects were there anyways. But IT support in the Swedish branch has kept it’s support area in Redmine, and since we manage support tickets there, I wanted to monitor it to make sure there were not unanswered tickets laying around.
I will describe the steps I did for setting up a CURE detector for monitoring Redmine project issues based on the DetectorTeamplate.ps1 described in CURE-Detector foundation and the instructions in CURE-Detector-step-by-step. The whole detector script can be found here
Please note, in Redmine it’s named Issues, but usually when talking about support it’s called Tickets. I will switch back and forth referring to it as either issues or tickets but it’s the same in this context.
Approach
Many years ago, I wrote a set of functions to interact with the Redmine REST API, and those functions were perfect to reuse for my use-case, at least the Get-RedmineIssue function. So I had a way to get the Issues out, but I also wanted to get a warning when there were unanswered support issues with in a set amount of business hours. Helpdesk at our company don’t work weekends, and national holidays, so I needed the detector to turn yellow/red based on when the ticket was received and how many work hours had passed since. I ended up with Test-Holiday that (if not already available) downloads the Swedish holidays for the current year to a csv and returns True/False when run based on if it’s a weekend/holiday or workday. The Get-Workhours takes a start date and returns the amount of business hours that has passed since then, using Test-Holiday as a support function. Since I knew Get-Workhours would be useful for monitoring the other Branch offices’ support systems as well, I decided to make it as general and re-usable as possible. Also Test-Holiday can be re-used, but at its current form only deals with Swedish holidays.
LOCAL SETTINGS, FUNCTIONS AND DEPENDENCIES
$detectorName = "Redmine Issues"
(cat -path $rootPath\modules\Get-RedmineIssue.ps1 | out-string) | iex
$projID = 123
$excludeIssues = @(123,456,789)
$itstaff = @("IT Staff1","IT Staff2","IT Staff3","IT Staff4")
$DefaultRedmineURI = "https://myredmine.fqdn"
$DefaultRedmineApiKey = "DefaultRedmineApiKey"
$noAnswerRedHours = 4
$noAnswerYellowHours = 2
$noAnswerFollowUpRedHours = 70
$noAnswerFollowUpYellowHours = 35
In the Local Settings section, on row 2, I load the Get-RedmineIssue function. On row 3 I set the id of the project to monitor for issues, on row 4 I have an array of issue ids to exclude from monitoring, on row 5 I have an array of IT-staff full names (to determine who’s IT and not). On row 8-10 I set the thresholds for when to give red/yellow alerts in CURE.
CONNECT AND COLLECT
<# this is custom #>
try {$issues = Get-RedmineIssue -Filter -ProjectID $projID -EA stop -WA silentlycontinue}
catch {
  $localEvent.descriptionDetails = $_
  $localEvent.status = 'grey'
  $localEvent.eventShort = "Unable to connect to $DefaultRedmineURI"
  $Disconnected = $True
}
In the CONNECT AND COLLECT section of the script I just use the Get-RedmineIssue function and filter on $projID to get the support tickets.
ANALYZE
<# this is custom #>
If (!$Disconnected)
{
  $report = $issues | where {$_.id -notin $excludeIssues} | select id,subject,`
    @{n="author";e={$_.author.name}},`
    @{n="state";e={$_.status.name}},`
    @{n="category";e={$_.category.name}},`
    @{n="latest_answer_by";e={((Get-RedmineIssue -ID $_.id -Include journals).journals | sort created_on -Descending | select -Index 0).user.name}},`
    created_on,updated_on,`
    @{n="unanswered_hours";e={$null}},`
    @{n="status";e={$null}}
  foreach ($i in $report)
  {
    $i.unanswered_hours =  Get-Workhours $i.updated_on
    if ($i.category -like "Follow-up")
    {
      if ($i.unanswered_hours -gt $noAnswerFollowUpRedHours) {$i.status = "red"}
      elseif ($i.unanswered_hours -gt $noAnswerFollowUpYellowHours) {$i.status = "yellow"}
      else {$i.status = "green"}
    }
    elseif (($i.latest_answer_by -notin $itstaff) -and ($i.state -notlike "Resolved"))
    {
      if ($i.unanswered_hours -gt $noAnswerRedHours) {$i.status = "red"}
      elseif ($i.unanswered_hours -gt $noAnswerYellowHours) {$i.status = "yellow"}
      else {$i.status = "green"}
    }
    else {$i.status = "green"}
  }
  [datetime]$latestupdate = ($report.updated_on | sort -Descending | select -Index 0)
  $noNew = Get-ItemCount ($report | where {$_.state -like "New"})
  $noRed = Get-ItemCount ($report | where {$_.status -like "Red"})
  $noYellow = Get-ItemCount ($report | where {$_.status -like "Yellow"})
  $noOpen = Get-ItemCount ($report | where {$_.state -notlike "Resolved"})
  if ($noRed -gt 0) {$localEvent.status = "red"}
  elseif ($noYellow -gt 0) {$localEvent.status = "yellow"}
  else {$localEvent.status = "green"}
  $localEvent.eventShort = "$noNew new issues, $noRed urgent issues, $noYellow late issues, $noOpen open issues, $($latestupdate.ToString())"
  $localEvent.descriptionDetails = ($report | sort status -Descending | ConvertTo-Json)
  $localEvent.contentType = "json"
}
In the ANALYZE section of the script, on rows 4-11, I create a PSCustomObject based on the issues collected in CONNECT AND COLLECT. On row 8 I once again use Get-RedmineIssue with filter -include journals to determine the latest_answer_by property. On rows 12-28 I loop through the tickets in the report object to set a red/yellow/green status for each ticket based on the number of hours passed without reply from a member of $itstaff. Also, on rows 15-20, we have a custom category Follow-up to set on a support ticket. That indicates that helpdesk is working on it, and therefore should have other thresholds before turning yellow/red. On rows 29-39 the $localEvent object is populated with values ready to be shoved into the CURE database.
Result
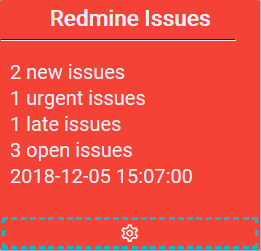
Here’s how the detector would look in the UI with a couple of late issues.

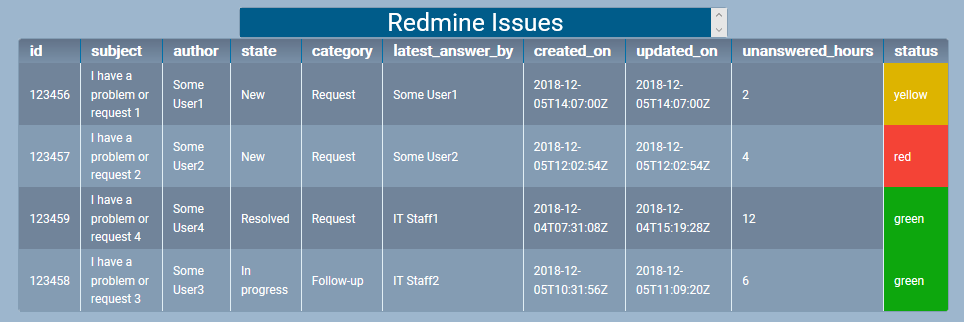
And if you click the headline you get the details of the detected issues.

The personal experiences, viewpoints and opinions expressed in this blog post are my own and in no way represent those of the company.
