
CURE - Detector Netskope
CURE - The homebrewed monitoring solution. Read more about it in my previous posts:
- CURE-Design
- CURE-Environment
- CURE-Database design
- CURE-Detector foundation
- CURE-Detector-step-by-step
- CURE-GUI
Background
As described here and here, the company, on my assignment, had stepped up its InfoSec game. Part of the solution was to extend the capabilities of our already implemented CASB solution Netskope.
I will describe the steps I did for setting up a CURE detector for monitoring Netskope alerts based on the DetectorTeamplate.ps1 described in CURE-Detector foundation and the instructions in CURE-Detector-step-by-step. The whole detector script can be found here
Approach
The Netskope REST API (I cannot link to info, since there is no public documentation, it’s only available in logged-in mode) is not great, at least the documentation is sub-par, and we had to spend a lot of time in Postman, trial-and-erroring all types of query combinations we could come up with to get the data we wanted. But, once we got the hang of it, it’s been working as expected. Since there are many different types of events generated (DLP, Anomaly, Compromised Credential, Malware, Watchlist, Security Assessment, Remediation, Quarantine, Policy, Malsite, Legal hold), and since all these different event types has different properties, the coding for this particular detector proved to be a hassle. The approach was to show unacknowledged alerts, meeting specific criteria for each event type, in CURE as they were being generated. To acknowledge them, and thereby removing them from CURE, we use the built in acknowledge button in the Netskope GUI.
LOCAL SETTINGS, FUNCTIONS AND DEPENDENCIES
$detectorName = "Netskope"
$knownLocations = @("Location1","Location2")
$knownIPs = @("xxx.xxx.xxx.xxx","yyy.yyy.yyy.yyy")
$key = Receive-Credential -SavedCredential MyAPIKey -Type ClearText
$baseUrl = "https://MyTennant.goskope.com/api/v1/alerts?token=" + $key + "&timeperiod=2592000&acked=false"
$queries = @{
 DLP = "&type=DLP&query=dlp_rule_severity in ['Critical','High','Medium']"
 Anomaly = "&type=anomaly&query=risk_level eq 'high'"
 'Compromised Credential' = "&query=alert_type eq 'Compromised Credential'"
 Malware = "&query=alert_type eq 'Malware'"
 Watchlist = "&query=alert_type eq 'watchlist'"
 'Security Assessment' = "&query=alert_type eq 'Security Assessment'"
 Remediation = "&query=alert_type eq 'Remediation'"
 Quarantine = "&query=alert_type eq 'quarantine'"
 Policy = "&query=alert_type eq 'policy'"
 Malsite = "&query=alert_type eq 'malsite'"
 'Legal Hold' = "&query=alert_type eq 'Legal Hold'"
}
Function Convert-FromUnixDate ($UnixDate) {
   [timezone]::CurrentTimeZone.ToLocalTime(([datetime]'1/1/1970').AddSeconds($UnixDate))
}
[Net.ServicePointManager]::SecurityProtocol = [Net.SecurityProtocolType]::Tls12 -bor [Net.SecurityProtocolType]::Tls11 -bor [Net.SecurityProtocolType]::Tls
In the Local Settings I defined a hash table of queries for each event type. Since the properties, and also the stuff we were interested in seeing, are different for each event type, I needed to separate them. On rows 17-19 is a small function to convert unix timestamps to human readable time stamps. On row 20, I force the use of TLS 1.2 to avoid errors in Invoke-RestMethod.
CONNECT AND COLLECT
<# this is custom #>
$collect = @()
foreach ($key in $queries.keys)
{
  $url = $baseUrl + $queries.$key
  try {$fetch = Invoke-RestMethod $url -EA stop}
  catch {
    $localEvent.descriptionDetails = $_
    $localEvent.status = 'grey'
    $localEvent.eventShort = "Unable to get Netskope data"
    $Disconnected = $True
    Continue
  }
  $collect += "" | select `
   @{n="Name";e={$key}},`
   @{n="state";e={$fetch.status}},`
   @{n="status";e={$null}},`
   @{n="msg";e={$fetch.msg + '-' + $($fetch.errors -join ', ') + '-' + $fetch.errorCode}},`
   @{n="data";e={$fetch.data}}
}
In the CONNECT AND COLLECT section of the script, on rows 3-20, I loop through the $queries hash table, executing each custom query and adding the results for each event type to the $collect array.
ANALYZE
<# this is custom #>
If (!$Disconnected)
{
  $alerts = @()
  foreach ($i in $collect)
  {
    if (!$i.data)
    {
      if ($i.state -notlike "success")
      {
        $alerts += "" | select `
         @{n="alert_type";e={$i.Name}},`
         @{n="dlp_incident_id";e={$null}},`
         @{n="alert_name";e={"CURE"}},`
         @{n="app";e={"CURE"}},`
         @{n="object";e={$i.state + '-' + $i.msg}},`
         @{n="user";e={$null}},`
         @{n="exposure";e={$null}},`
         @{n="dlp_rule_severity";e={$null}},`
         @{n="risk_level";e={$null}},`
         @{n="breach_score";e={$null}},`
         @{n="timestamp";e={$null}},`
         @{n="alerts";e={$null}},`
         @{n="status";e={"grey"}}
      }
    }
    else
    {
      foreach ($alert in $i.data)
      {
        if ($alert.object)
        {
          $objArr = $alert.object -split '/'
          if ($objArr.count -gt 1) {$object = '~' + $objArr[-1]}
          else {$object = $alert.object}
        }
        else {$object = $alert.user}
        if ($alert.dlp_rule_severity -like "critical") {$status = "red"}
        elseif (($alert.exposure -in @("public","external")) -and ($alert.dlp_rule_severity -like "High")) {$status = "red"}
        elseif ($alert.dlp_rule_severity -like "High") {$status = "yellow"}
        elseif (($alert.exposure -in @("public","external")) -and ($alert.dlp_rule_severity -like "Medium")) {$status = "yellow"}
        elseif ($alert.dlp_rule_severity -like "Medium") {Continue}
        elseif (($alert.alert_type -like "anomaly") -and ($alert.event_type -like "risky_country") -and ($alert.src_location -like $knownLocations) -and ($alert.userip -in $knownIPs)) {Continue}
        else {$status = "yellow"}
        $alerts += $alert | select alert_type,dlp_incident_id,alert_name,app,@{n="object";e={$object}},user,exposure,dlp_rule_severity,risk_level,breach_score,@{n="timestamp";e={(Convert-FromUnixDate $alert.timestamp).ToString()}},@{n="status";e={$status}}
      }
    }
  }
  $report = @()
  foreach ($t in ($alerts.alert_type | select -Unique))
  {
    $ctype = $alerts | where {$_.alert_type -eq $t}
    foreach ($o in ($ctype.object | select -unique))
    {
      $cobj = $ctype | where {$_.object -eq $o}
      if ($cobj.status -match "red") {$cstatus = "red"}
      elseif ($cobj.status -match "yellow") {$cstatus = "yellow"}
      else {$cstatus = "grey"}
      $report += "" | select `
       @{n="alert_type";e={$t}},`
       @{n="dlp_incident_id";e={($cobj.dlp_incident_id | select -unique) -join ', '}},`
       @{n="alert_name";e={($cobj.alert_name | select -unique) -join ', '}},`
       @{n="app";e={($cobj.app | select -unique) -join ', '}},`
       @{n="object";e={$o}},`
       @{n="user";e={($cobj.user | select -unique) -join ', '}},`
       @{n="exposure";e={($cobj.exposure | select -unique) -join ', '}},`
       @{n="dlp_rule_severity";e={($cobj.dlp_rule_severity | select -unique) -join ', '}},`
       @{n="risk_level";e={($cobj.risk_level | select -unique) -join ', '}},`
       @{n="breach_score";e={($cobj.breach_score | select -unique) -join ', '}},`
       @{n="timestamp";e={($cobj.timestamp | sort)[0]}},`
       @{n="alerts";e={(Get-ItemCount $cobj)}},`
       @{n="status";e={$cstatus}}
    }
  }
  $noDLP = Get-ItemCount ($report | where {$_.alert_type-like "DLP"})
  $noAnomaly = Get-ItemCount ($report | where {$_.alert_type-like "anomaly"})
  $noCredential = Get-ItemCount ($report | where {$_.alert_type-like "Compromised Credential"})
  $noOther = Get-ItemCount ($report | where {$_.alert_type -notin @("Compromised Credential","DLP","anomaly")})
  $localEvent.eventShort = "$noDLP DLP incidents, $noAnomaly Anomalies, $noCredential Compromised, $noOther Other event types"
  if ($report.Status -match "red") {$localEvent.status = "red"}
  elseif ($report.Status -match "yellow") {$localEvent.status = "yellow"}
  elseif ($report.Status -match "grey") {$localEvent.status = "grey"}
  else {$localEvent.status = "green"}
  $localEvent.descriptionDetails = ($report | ConvertTo-Json)
  $localEvent.contentType = "json"
}
Since any object scanned by Netskope can generate a lot of alerts, I needed to do the analyzing in two steps. First go through all individual events, and then consolidate them to center around object. So, in the ANALYZE section of the script I ended up with a lot of code. There’s probably a way to do this more elegantly, but hey, this works. On rows 5-48 I extract the data from the $collect object and bake it into a unified format, so that all event types can fit. The alerts are then moved into the $alerts array. On rows 9-25, I handle any connection and/or collection errors. On rows 29-46 I go through all retrieved alerts, set their individual status and add to the $alerts array. On rows 50-74, I loop through all the distinct event types collected in $alerts, select the alerts associated with each event type, then, on rows 53-73, loop through the distinct object names for each event type, create a PSCustomObject for each object name, fill it with the associated events data, and add it into the $report array. Makes sense? On rows 75-85 I set the overall status and populate $localEvent, making it ready to be shoved into the CURE database.
Result
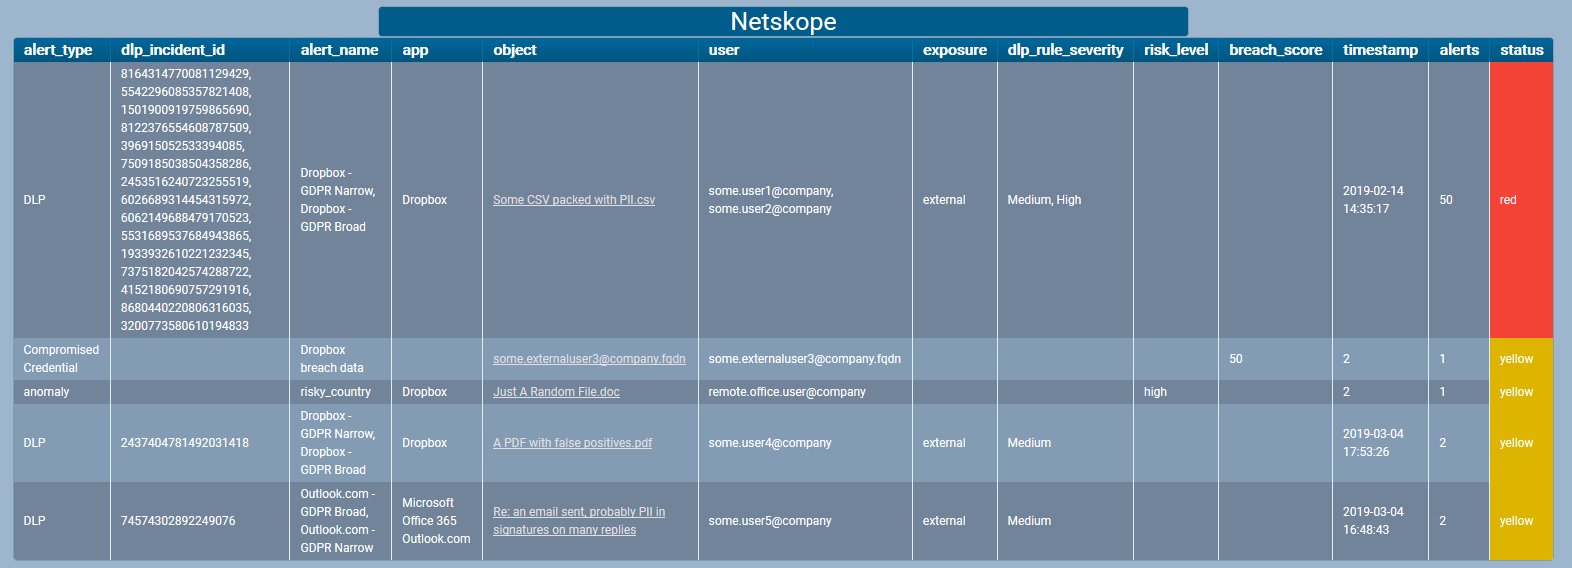
Here’s how the detector would look in the UI with some alerts for detected security threats.
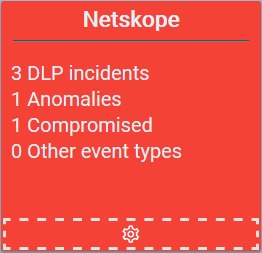
And if you click the headline you get the details of the alerts.
The personal experiences, viewpoints and opinions expressed in this blog post are my own and in no way represent those of the company.