CURE - Detector CBD Endpoints
CURE - The homebrewed monitoring solution. Read more about it in my previous posts:
- CURE-Design
- CURE-Environment
- CURE-Database design
- CURE-Detector foundation
- CURE-Detector-step-by-step
- CURE-GUI
Background
As described here and here, the company, on my assignment, had stepped up its InfoSec game. Part of the solution was to implement client anti-malware system Carbon Black Defense. However, the roll-out has not been frictionless, and since we allow (for now) end users to disable the agent, we needed a way to monitor this.
I will describe the steps I did for setting up a CURE detector for monitoring CBD Endpoints based on the DetectorTeamplate.ps1 described in CURE-Detector foundation and the instructions in CURE-Detector-step-by-step. The whole detector script can be found here
Approach
Thankfully, Carbon Black has a set of REST APIs. The API service is, at the time of writing, buggy and unstable, but hey, at least it’s there! For this particular use case, we decided to only monitor Endpoint status. In a future detector we’ll look at actual malware events. I decided to leave the coding of this detector to my colleagues Fredrik and Micke, but with stern orders to follow the template for setting up a detector.
LOCAL SETTINGS, FUNCTIONS AND DEPENDENCIES
$detectorName = "CBD Endpoints"
$CDBToken = Receive-Credential -SavedCredential MyCBDToken -Type ClearText
$connectorId = "MyCBDconnetorID"
$uri = "https://MyCBDHost.conferdeploy.net/integrationServices/v3/device?start=1&rows=5000"
$header = @{"X-Auth-Token" = "$CDBToken/$connectorId"}
In the Local Settings section they basically just added the settings for our particular CBD environment. As a side note, we’ve had this detector running for a couple of months, and the API service has been down numerable times. We have nagged support, they have restarted the service and it has worked for a while. Repeatedly. Now, since a couple of weeks, we’ve received a new URI to use, and so far, it’s been stable. As another side note, we decided to just fetch the max amount of records (5000) since we couldn’t get pagination to work. This is not a clean solution, but since there’s a while left until we reach 5000 endpoints (I would say never) we just settled for this ugly approach.
CONNECT AND COLLECT
<# this is custom #>
try {$response = Invoke-RestMethod -Uri $uri -header $header -contenttype "application/json;charset=utf8" -method GET -ea Stop}
catch {
  $localEvent.descriptionDetails = $_
  $localEvent.status = 'grey'
  $localEvent.eventShort = "Unable to connect to CBD API"
  $Disconnected = $True
}
if (!$Disconnected)
{
  if (!$response.success)
  {
    $localEvent.descriptionDetails = $response.message
    $localEvent.status = 'grey'
    $localEvent.eventShort = "Error when collecting from CBD API"
    $Uncollected = $true
  }
}
In the CONNECT AND COLLECT section of the script, on rows 2-8, the endpoint status is retrieved into the $response object. On rows 9-17, a successful collection is validated.
ANALYZE
<# this is custom #>
If (!$Disconnected -and !$Uncollected)
{
  $report = $response.results | Select-Object @{n="User"; e={$_.email}}, @{n="Device"; e={$_.name}}, @{n="OS"; e={$_.osVersion}}, @{n="Policy"; e={$_.policyName}}, @{n="Sensor"; e={$_.sensorVersion}}, @{n="OutOfDate"; e={$_.SensorOutOfDate}}, @{n="State"; e={$_.status}}, @{n="Quarantined"; e={$_.quarantined}}, @{n="Status"; e={$_.color}}
  foreach ($device in $report)
  {
    if ($device.quarantined) {$device.status = "red"}
    elseif ($device.state -eq "BYPASS") {$device.status = "yellow"}
    else {$device.status = "green"}
  }
  $noRed = Get-ItemCount ($report | where {$_.status -like "red"})
  $noYellow = Get-ItemCount ($report | where {$_.status -like "yellow"})
  $noOutDated = Get-ItemCount ($report | where {$_.OutOfDate -like "True"})
  if ($noRed -gt 0)
    {$localEvent.status = "red"}
  elseif ($noYellow -gt 0 -or $noOutDated -gt 0)
    {$localEvent.status = "yellow"}
  else
    {$localEvent.status = "green"}
  $localEvent.eventShort = "$noRed quarantined, $noYellow bypassed, $noOutDated outdated versions"
  $localEvent.descriptionDetails = ($report | sort status -Descending | where {$_.status -ne "green"} | ConvertTo-Json)
  $localEvent.contentType = "json"
}
In the ANALYZE section of the script, on row 4, the $response.results are baked into the PSCustomObject $report. On rows 5-10, $report is iterated and statuses are set based on if the endpoint is quarantined (red) or in bypass mode (yellow). On rows 11-22 the over all status is set and $localEvent is populated with the results, getting it prepared to be shoved into the CURE database.
Result
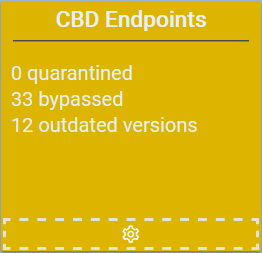
Here’s how the detector would look in the UI with outdated endpoints and endpoints in bypass mode.

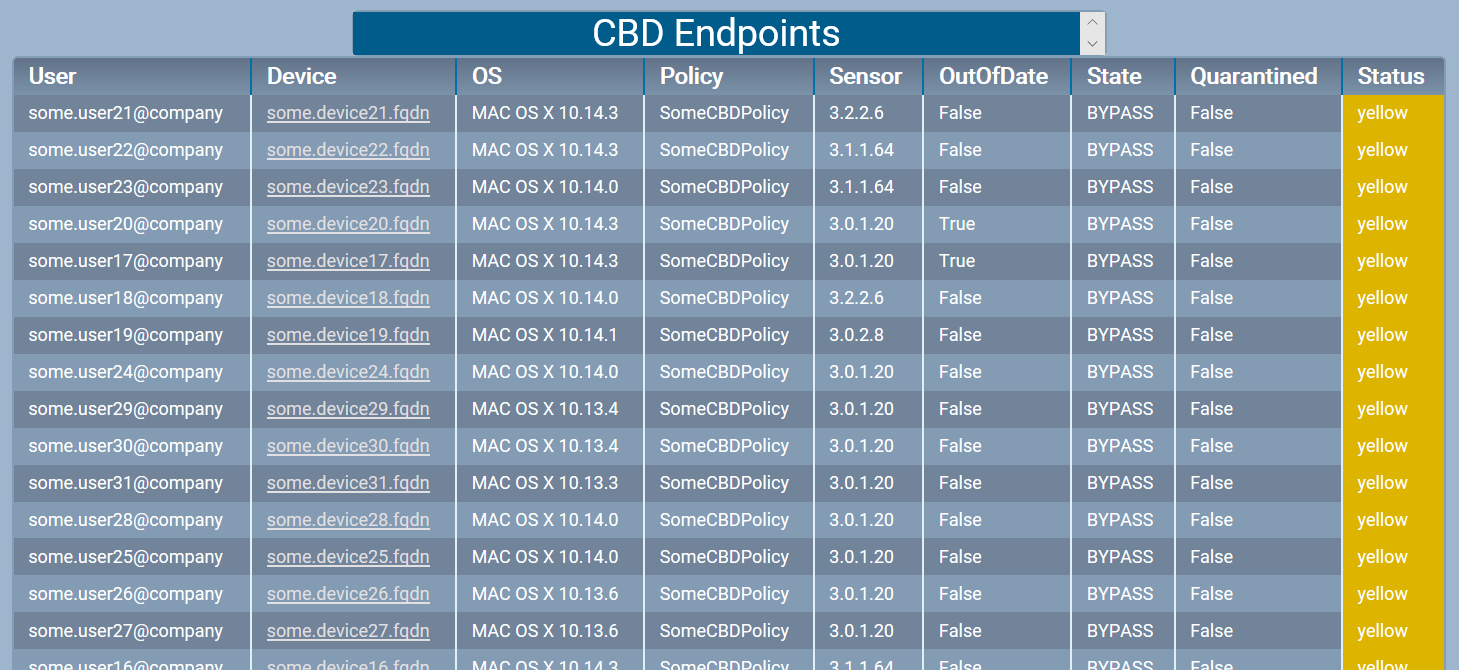
And if you click the headline you get the details of the alerts.

The personal experiences, viewpoints and opinions expressed in this blog post are my own and in no way represent those of the company.
